Master Shortcut's Core Features
These four features form the foundation of Shortcut. Master them to save hours every week on spreadsheet work.
AI Rules
Your AI preferences applied everywhere, automatically. Set rules once and they apply to every prompt you write.
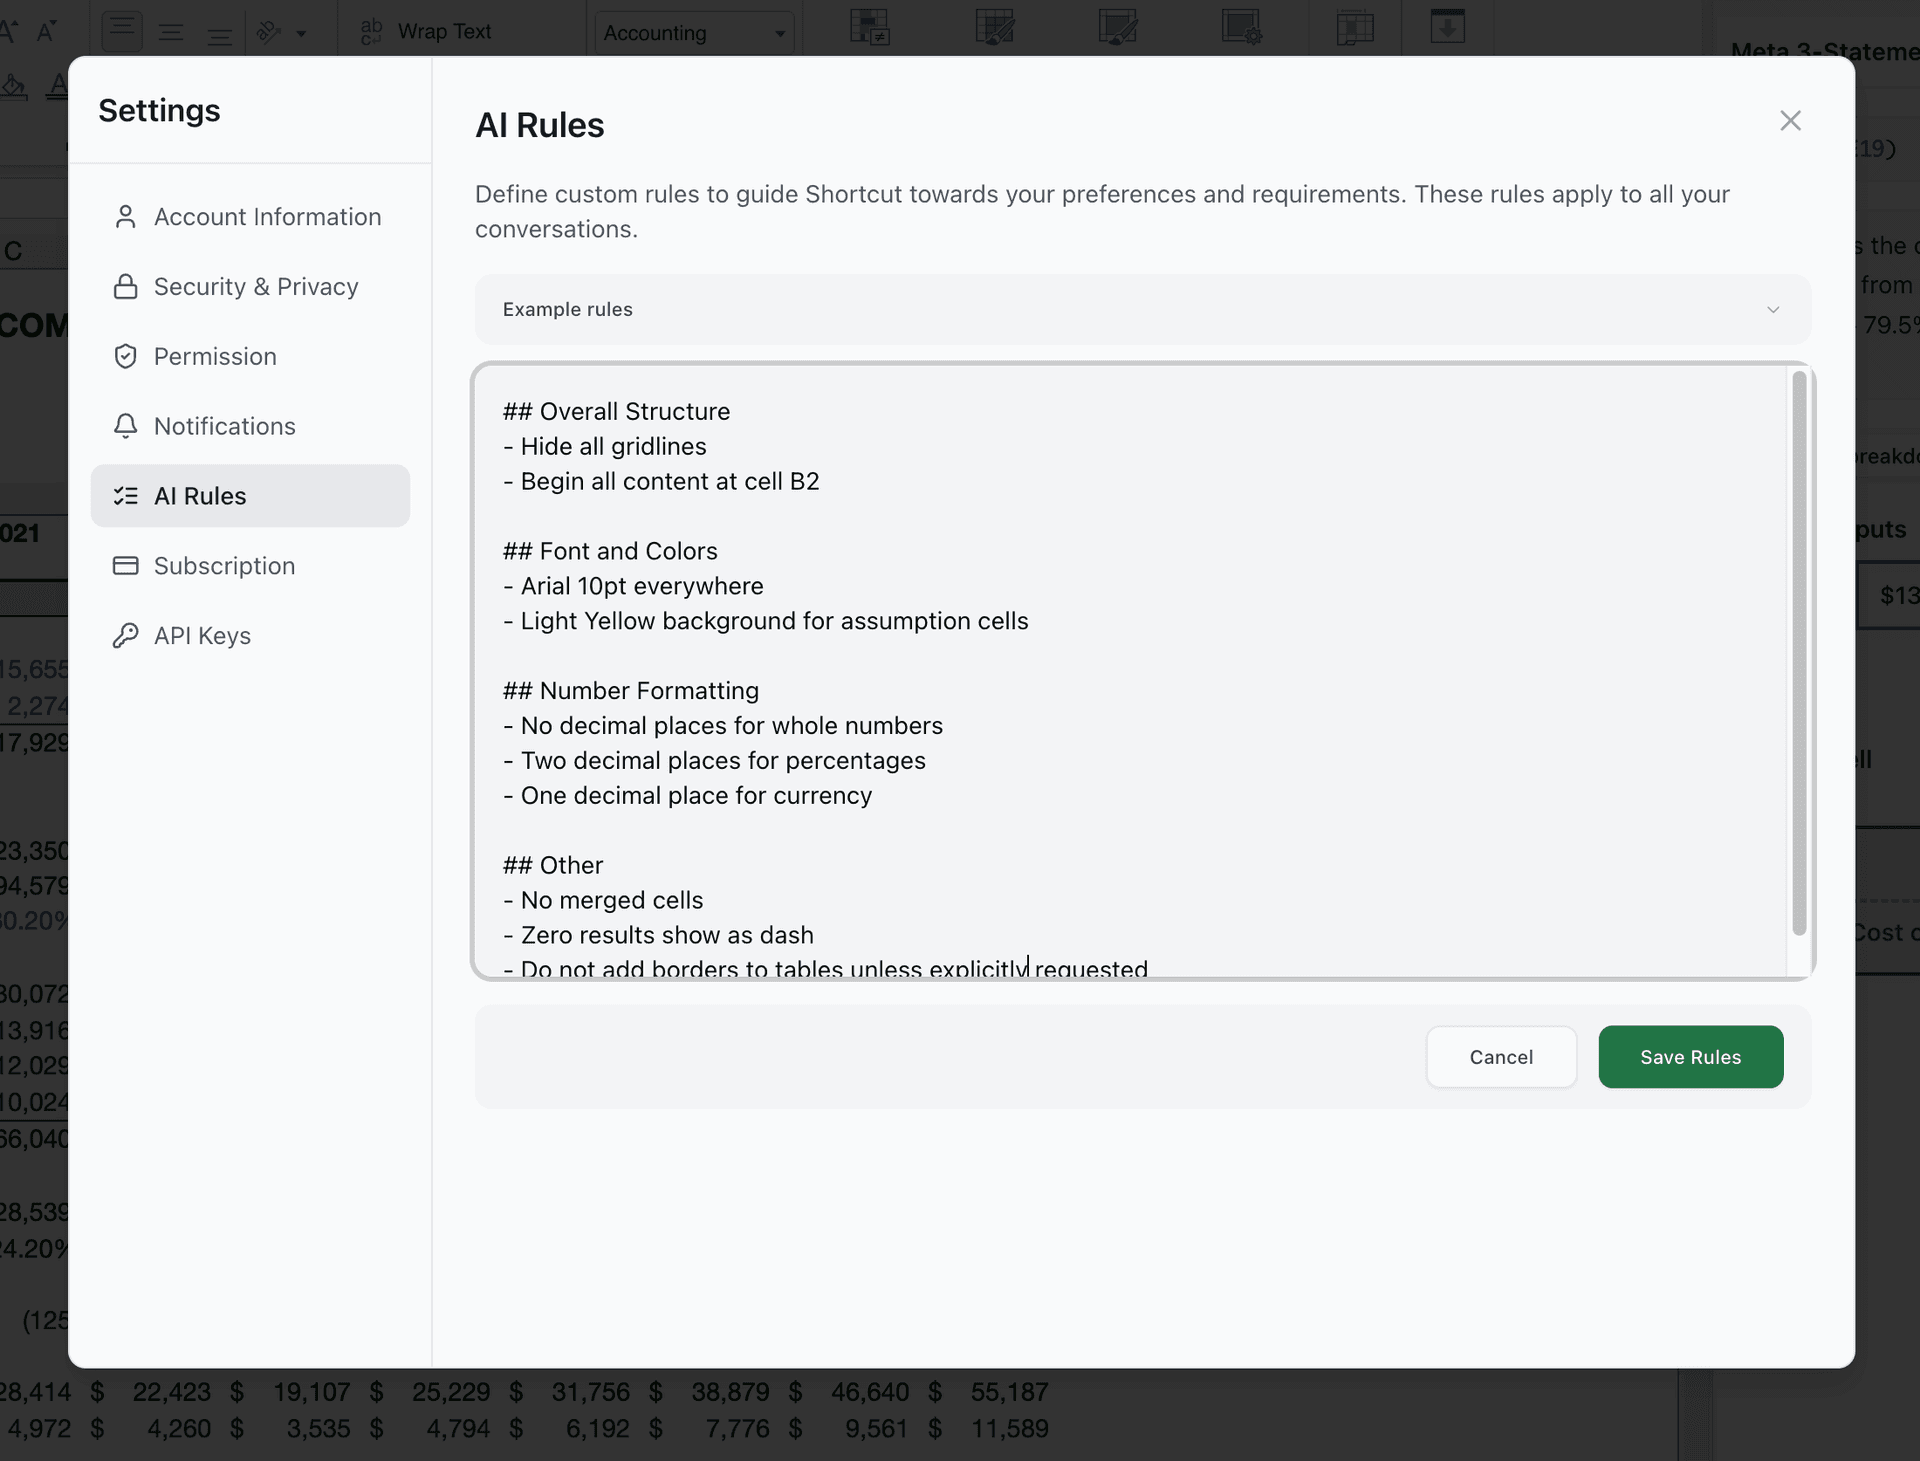
How to set up AI Rules:
- 1.Click Settings in the sidebar
- 2.Click AI Rules
- 3.Add rules like "Always format currency with $ symbol"
- 4.Rules apply to all future prompts automatically
Example Rules:
- • "Always format currency with $ symbol and 2 decimal places"
- • "Use blue headers (#217346) for all tables"
- • "Include percentage change columns in financial summaries"
- • "Add data validation to input cells"
Saved Prompts
Build a library of your best prompts for instant reuse. Stop rewriting the same prompts over and over.
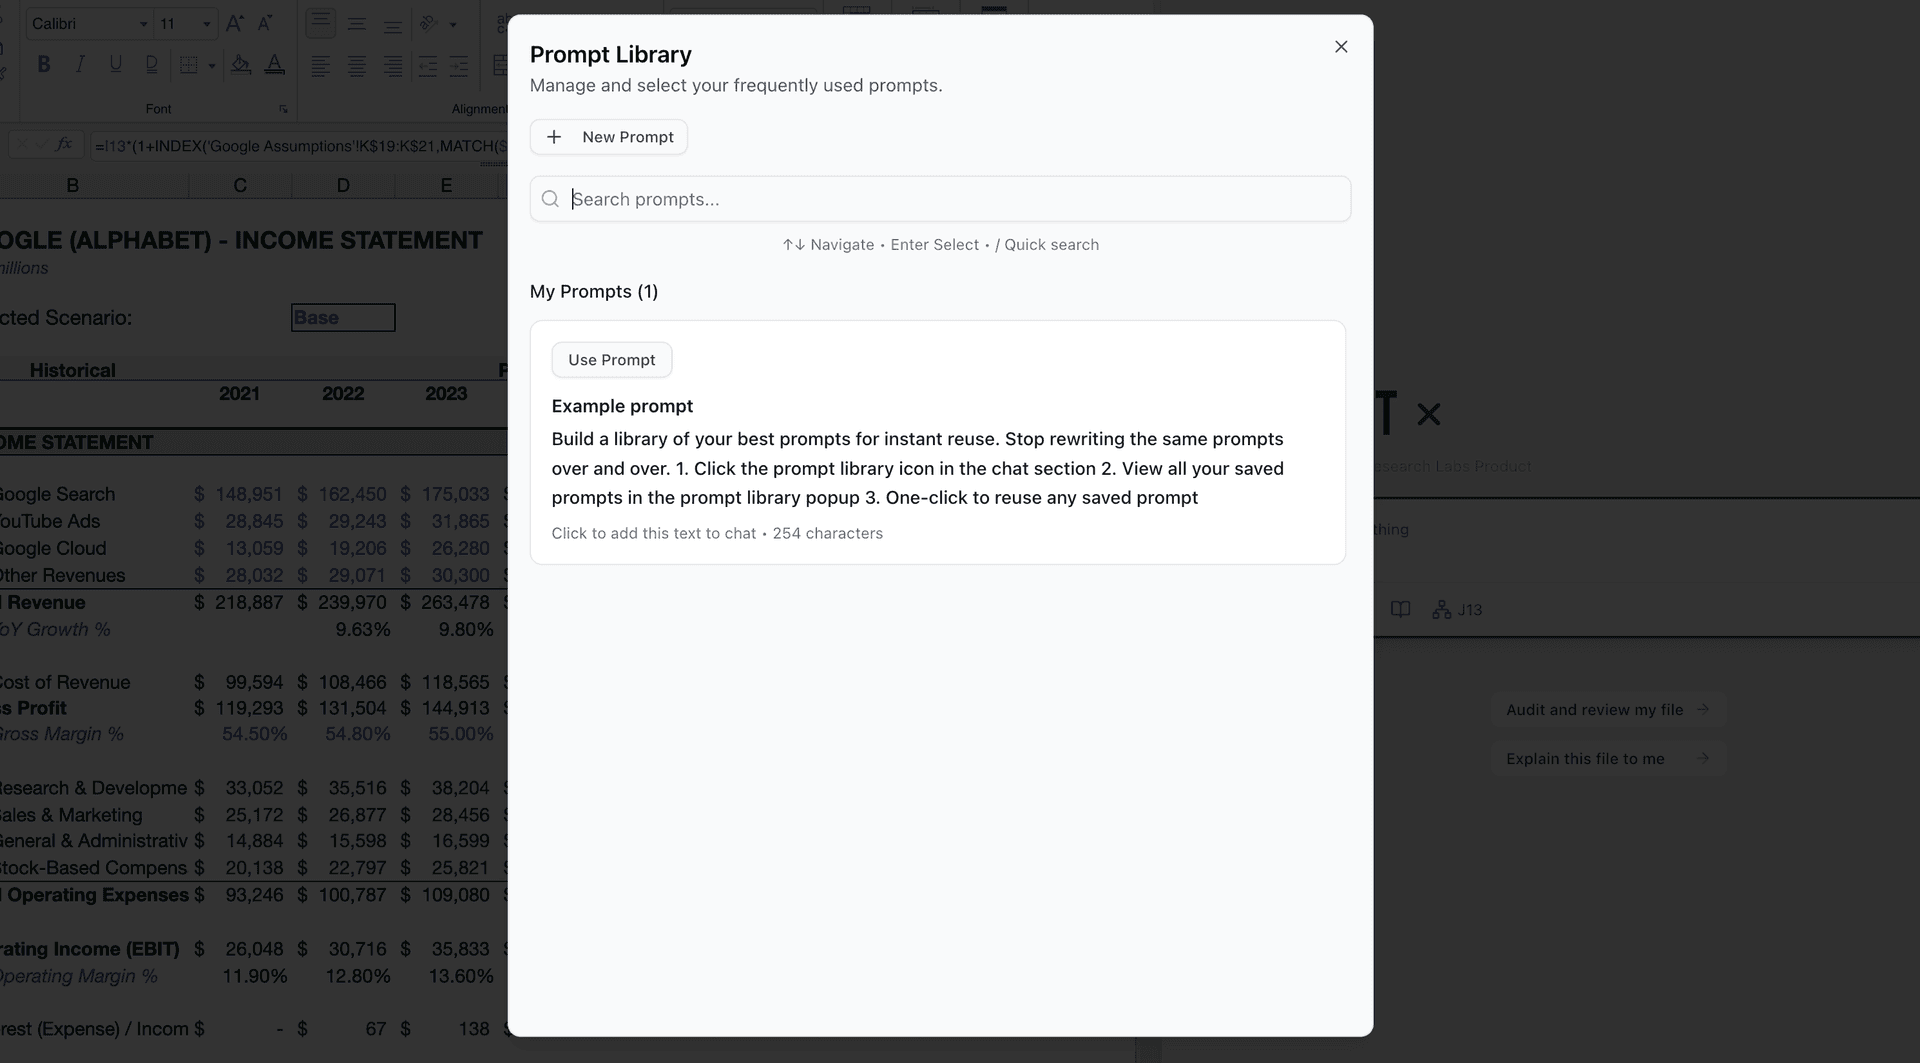
How to use Saved Prompts:
- 1.Click the prompt library icon in the chat section
- 2.View all your saved prompts in the prompt library popup
Popular Prompts to Save:
- • "Build a monthly budget tracker with income and expense categories"
- • "Create a pivot table summarizing sales by region and product"
- • "Format this data as a professional report with charts"
- • "Add conditional formatting to highlight outliers"
Templates
Save spreadsheets as reusable starting points. Start new projects faster with your proven structures.
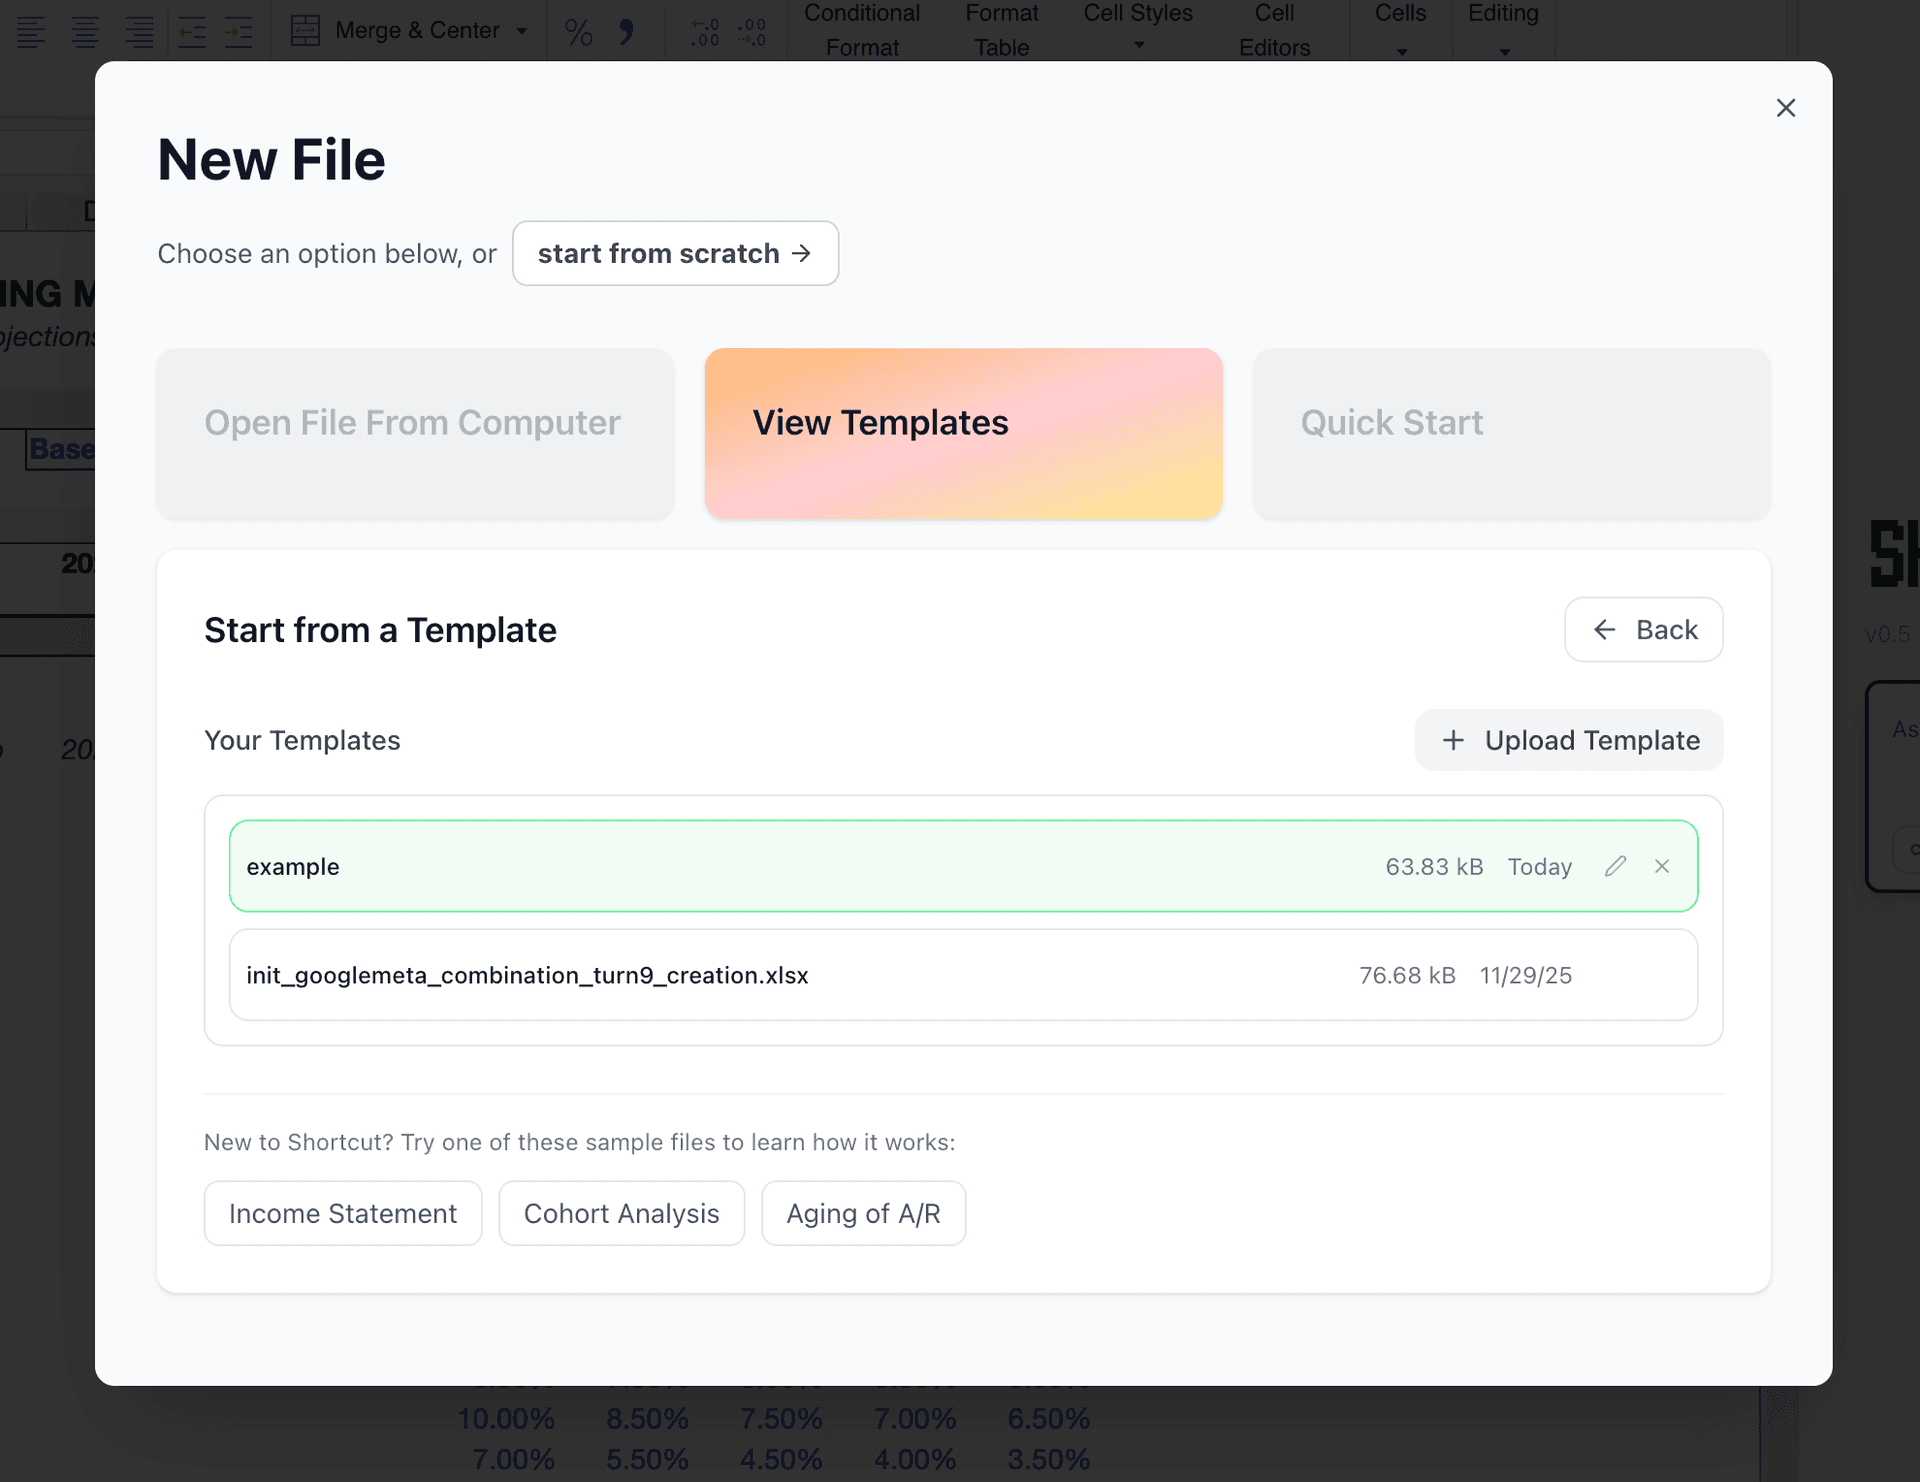
How to view Templates:
- 1.Click Open File
- 2.View Templates in the file picker
Template Ideas:
- • Monthly financial report structure
- • Project budget tracker
- • Sales pipeline dashboard
- • Meeting notes with action items
Formula Tracer
Understand any formula instantly. Click a cell to see exactly how values are calculated and where inputs come from.
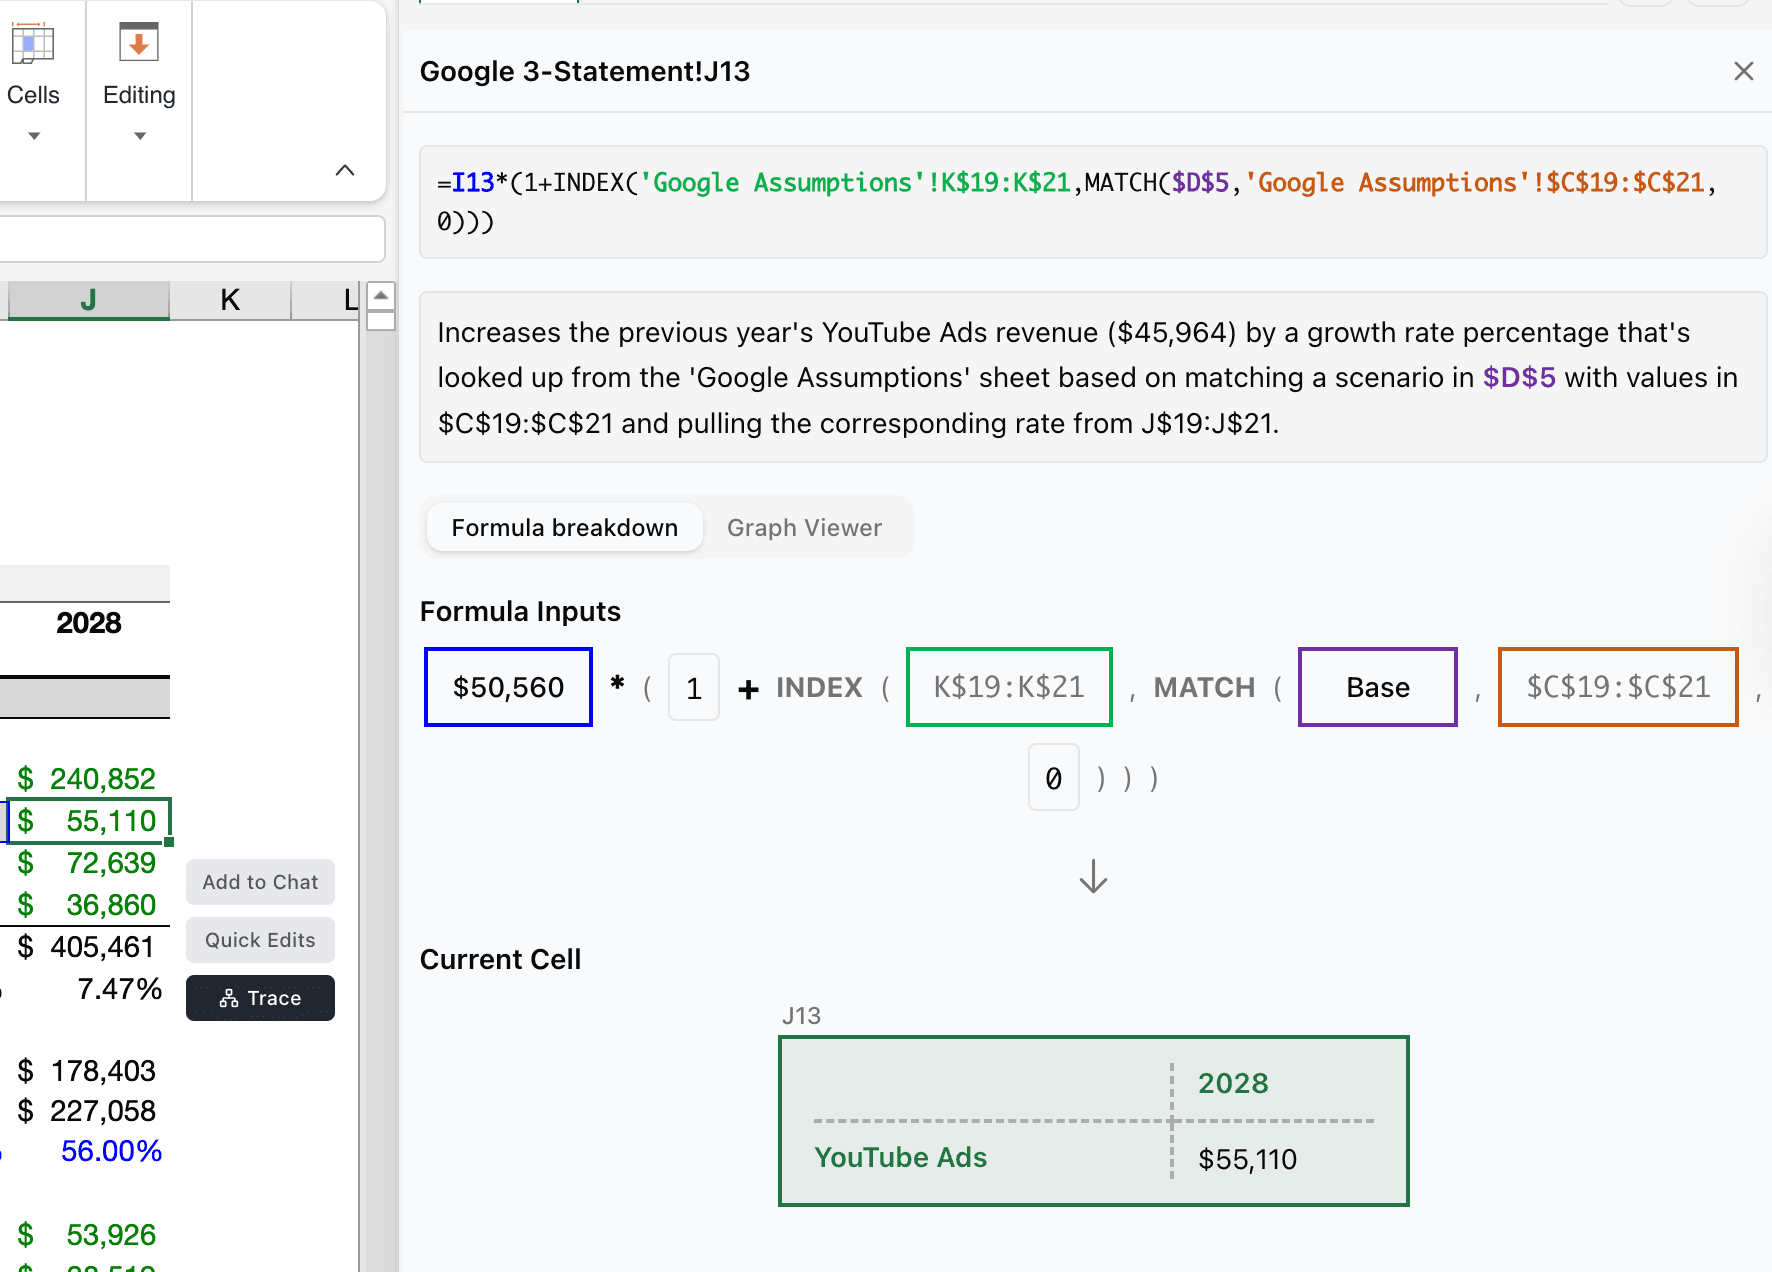
How to use Formula Tracer:
- 1.Click any cell with a formula
- 2.Click "Trace" to see the dependency tree
- 3.Follow the visual map to understand how values are calculated
Perfect for:
- • Auditing complex financial models
- • Understanding inherited spreadsheets
- • Debugging formula errors
- • Teaching others how your model works
Key Takeaways
- AI Rules - Set formatting preferences once, applied everywhere
- Saved Prompts - Build a reusable prompt library
- Templates - Start new projects from proven structures
- Formula Tracer - Understand any formula visually